Series: Building a Real-Time Data Platform from the Edge — Post 1 of 7. The full source is on GitHub: rpi-data-platform
Most data engineering tutorials assume you have a cloud account, a managed Kafka cluster, and an infinite credit card. This series assumes you have a Raspberry Pi, a couple of Zigbee sensors, and a reason to care about what happens between a physical device and a Delta Lake table.
The goal is not to build a production system. The goal is to build something real enough that the interesting problems show up — late-arriving data, schema evolution, checkpoint recovery, exactly-once semantics — on hardware you can hold in your hand.
What we are building
A self-contained real-time data platform that runs entirely on a Raspberry Pi 400. No cloud dependencies. No external services. One docker compose up and the full stack is running.
The platform ingests sensor data over Zigbee, routes it through MQTT and Kafka, processes it with Spark Structured Streaming, persists it in Delta Lake, and serves it through Grafana dashboards.
Here is the full architecture:

Every layer runs as a Docker container on the Pi. The only thing that lives outside Docker is the Zigbee USB dongle, which is passed through to the Zigbee2MQTT container via --device.
The hardware
| Component | Model | Role |
|---|---|---|
| Edge computer | Raspberry Pi 400 | Runs the full stack |
| Zigbee coordinator | Sonoff ZBDONGLE-E | USB radio, bridges Zigbee to software |
| Door/window sensor | Sonoff SNZB-04P | Open/close state, tamper detection |
| Smart plug | Sonoff S60ZBTPF | Power, voltage, current, energy monitoring |
The sensor choice is intentional. The SNZB-04P produces a sparse, event-driven stream — it only emits when state changes. The S60ZBTPF produces a richer, continuous stream with multiple numeric fields. Two sources, two schemas, two different arrival patterns — that contrast will matter when we get to watermarking and schema evolution in Delta Lake.
The stack
Edge layer
Zigbee2MQTT handles device pairing and translates Zigbee radio messages into structured JSON. It publishes to a local MQTT topic per device. You get a payload like this out of the box:
{
  "contact": true,
  "battery": 100,
  "tamper": false,
  "linkquality": 255
}
Mosquitto is the MQTT broker. It receives messages from Zigbee2MQTT and holds them until a consumer picks them up. Lightweight, battle-tested, runs in under 10MB of RAM.
Kafka producer is a small Python script that subscribes to the MQTT topics and publishes each message to a Kafka topic. This is the bridge between the edge world (MQTT, pull-based, lossy) and the streaming backbone (Kafka, durable, replayable).
Streaming backbone
Kafka in KRaft mode — no Zookeeper. KRaft is the production default since Kafka 3.3 and removes an entire moving part from the stack. On a Pi with 4GB RAM this matters.
A single topic sensor-events receives all sensor messages. We will partition by device type later when throughput justifies it.
Processing layer
Spark Structured Streaming reads from the Kafka topic and writes to Delta Lake. Single node, JVM heap capped at 512MB. More than enough for sensor data volumes.
This is where the interesting work happens: watermarking, late data handling, trigger intervals, checkpoint internals, exactly-once semantics via Delta’s idempotent transaction log. Each of these gets its own post.
Delta Lake on MinIO — MinIO provides S3-compatible object storage locally. Delta writes transaction logs and Parquet files exactly as it would on S3 or ADLS. The storage layer is swappable without touching the Spark job.
Serving layer
The serving layer splits into two independent paths.
Analytical path: Delta Lake → DuckDB → Grafana. DuckDB reads Delta Lake files natively from MinIO — no Spark, no extra infrastructure. DuckDB v0.10+ supports the Delta protocol directly, runs on arm64, and uses a fraction of the RAM a Spark query would. It runs as a lightweight batch job on the Pi and exposes query results to Grafana on a refresh schedule. Dashboards are near-real-time, not streaming — and that is fine for sensor data at this scale.
Keeping Spark out of the query path is deliberate. Spark handles streaming ingestion; DuckDB handles analytical reads. Two tools, two responsibilities, no contention for the Pi’s memory.
Operational path: Mosquitto → Python alerting script. Alerting subscribes directly to MQTT topics on Mosquitto — it never touches Delta Lake. When the door sensor goes offline or the smart plug reports an overload, the alert fires in seconds, not after the next batch write. Decoupling alerting from the batch layer keeps latency low and keeps the two concerns from interfering with each other.
Monitoring layer
A platform running unattended on a Pi needs observability. If Spark silently dies, if Kafka topic lag builds up, if a sensor drops off the Zigbee network, or if the Pi itself overheats — you need to know without SSHing in to check.
The monitoring layer is built on Prometheus + Grafana, the same Grafana instance used for sensor dashboards. Prometheus sits underneath every service and scrapes metrics on a 15-second interval. It does not receive data — services expose an HTTP /metrics endpoint and Prometheus pulls from it.
The practical question is what runs those endpoints. The answer depends on the service.
For off-the-shelf services, we use pre-built Go exporters. Go compiles to a single static binary with no runtime dependencies. The Docker images are 5–15MB, use under 10MB of RAM at runtime, and ship with native arm64 builds. You drop them into docker-compose.yml and they work. No code to write or maintain.
The exporters in this stack:
| Exporter | What it monitors | Image |
|---|---|---|
node_exporter | Pi CPU, RAM, disk, temperature | prom/node-exporter |
kafka_exporter | Topic lag, broker health, consumer groups | danielqsj/kafka-exporter |
mosquitto_exporter | Message throughput, connected clients | sapcc/mosquitto-exporter |
zigbee_exporter | Device availability, battery level, link quality per sensor | Custom · Python |
| MinIO metrics | Storage usage, request rates | Built-in — no extra container |
| Spark metrics | Job status, executor health, GC | Built-in — config flag only |
For Zigbee2MQTT, we write a small Python exporter. There is no off-the-shelf exporter for Zigbee2MQTT, so this is the one place where custom code is justified. The Python prometheus_client library exposes a /metrics endpoint with a built-in HTTP server — no Flask, no web framework needed:
from prometheus_client import start_http_server, Gauge
import paho.mqtt.client as mqtt

sensor_available = Gauge('zigbee_sensor_available', 'Sensor reachability', ['device'])

start_http_server(8000)  # Prometheus scrapes this endpoint
That is roughly the entire exporter. Prometheus scrapes localhost:8000/metrics and Grafana picks it up alongside everything else.
The result is a single Grafana instance with two dashboards: one for sensor data, one for platform health. Same tool, two concerns, no extra infrastructure.
Why everything runs on the Pi
The obvious question: why not run Kafka and Spark on your laptop and keep the Pi as a pure edge device?
Two reasons.
First, reproducibility. The repository goal is that anyone with a Pi and these sensors can clone it and have a running platform. That only works if the whole stack is self-contained. A docker-compose.yml that assumes a MacBook somewhere in the network is not a deployable artifact.
Second, constraints are interesting. Running Spark with a 512MB heap on a 4GB machine forces you to understand what Spark actually does with memory. You cannot hide behind cloud autoscaling. When the executor runs out of memory, you have to fix it properly.
Repository structure
rpi-data-platform/
├── docker-compose.yml
├── .env.example
├── services/
│   ├── zigbee2mqtt/
│   ├── mosquitto/
│   ├── kafka/
│   ├── spark/
│   ├── minio/
│   ├── grafana/
│   └── prometheus/
├── jobs/
│   ├── sensor_stream.py
│   └── duckdb_query.py
├── alerting/
│   └── mqtt_alerter.py
├── monitoring/
│   ├── prometheus.yml
│   ├── zigbee_exporter.py
│   └── dashboards/
│       ├── sensors.json
│       └── platform.json
├── docs/
│   └── architecture.md
└── README.md
One docker compose up starts everything. Device-specific configuration (Zigbee dongle path, sensor IDs) lives in .env.
What comes next
This series builds the platform incrementally. Each post ships working code into the repository.
| Post | Topic |
|---|---|
| Post 1 (this one) | Architecture overview |
| Post 2 | Flashing Raspberry Pi OS Lite, headless setup, Docker install |
| Post 3 | Zigbee2MQTT + Mosquitto: pairing sensors, understanding MQTT payloads |
| Post 4 | Kafka on arm64: KRaft mode, topic design, the Python producer bridge |
| Post 5 | Spark Structured Streaming + Delta Lake: checkpoints, exactly-once, late data |
| Post 6 | DuckDB + Grafana: serving Delta Lake data without Spark |
| Post 7 | Platform monitoring: Prometheus, Go exporters, and keeping the Pi healthy |
Prerequisites
To follow along you need:
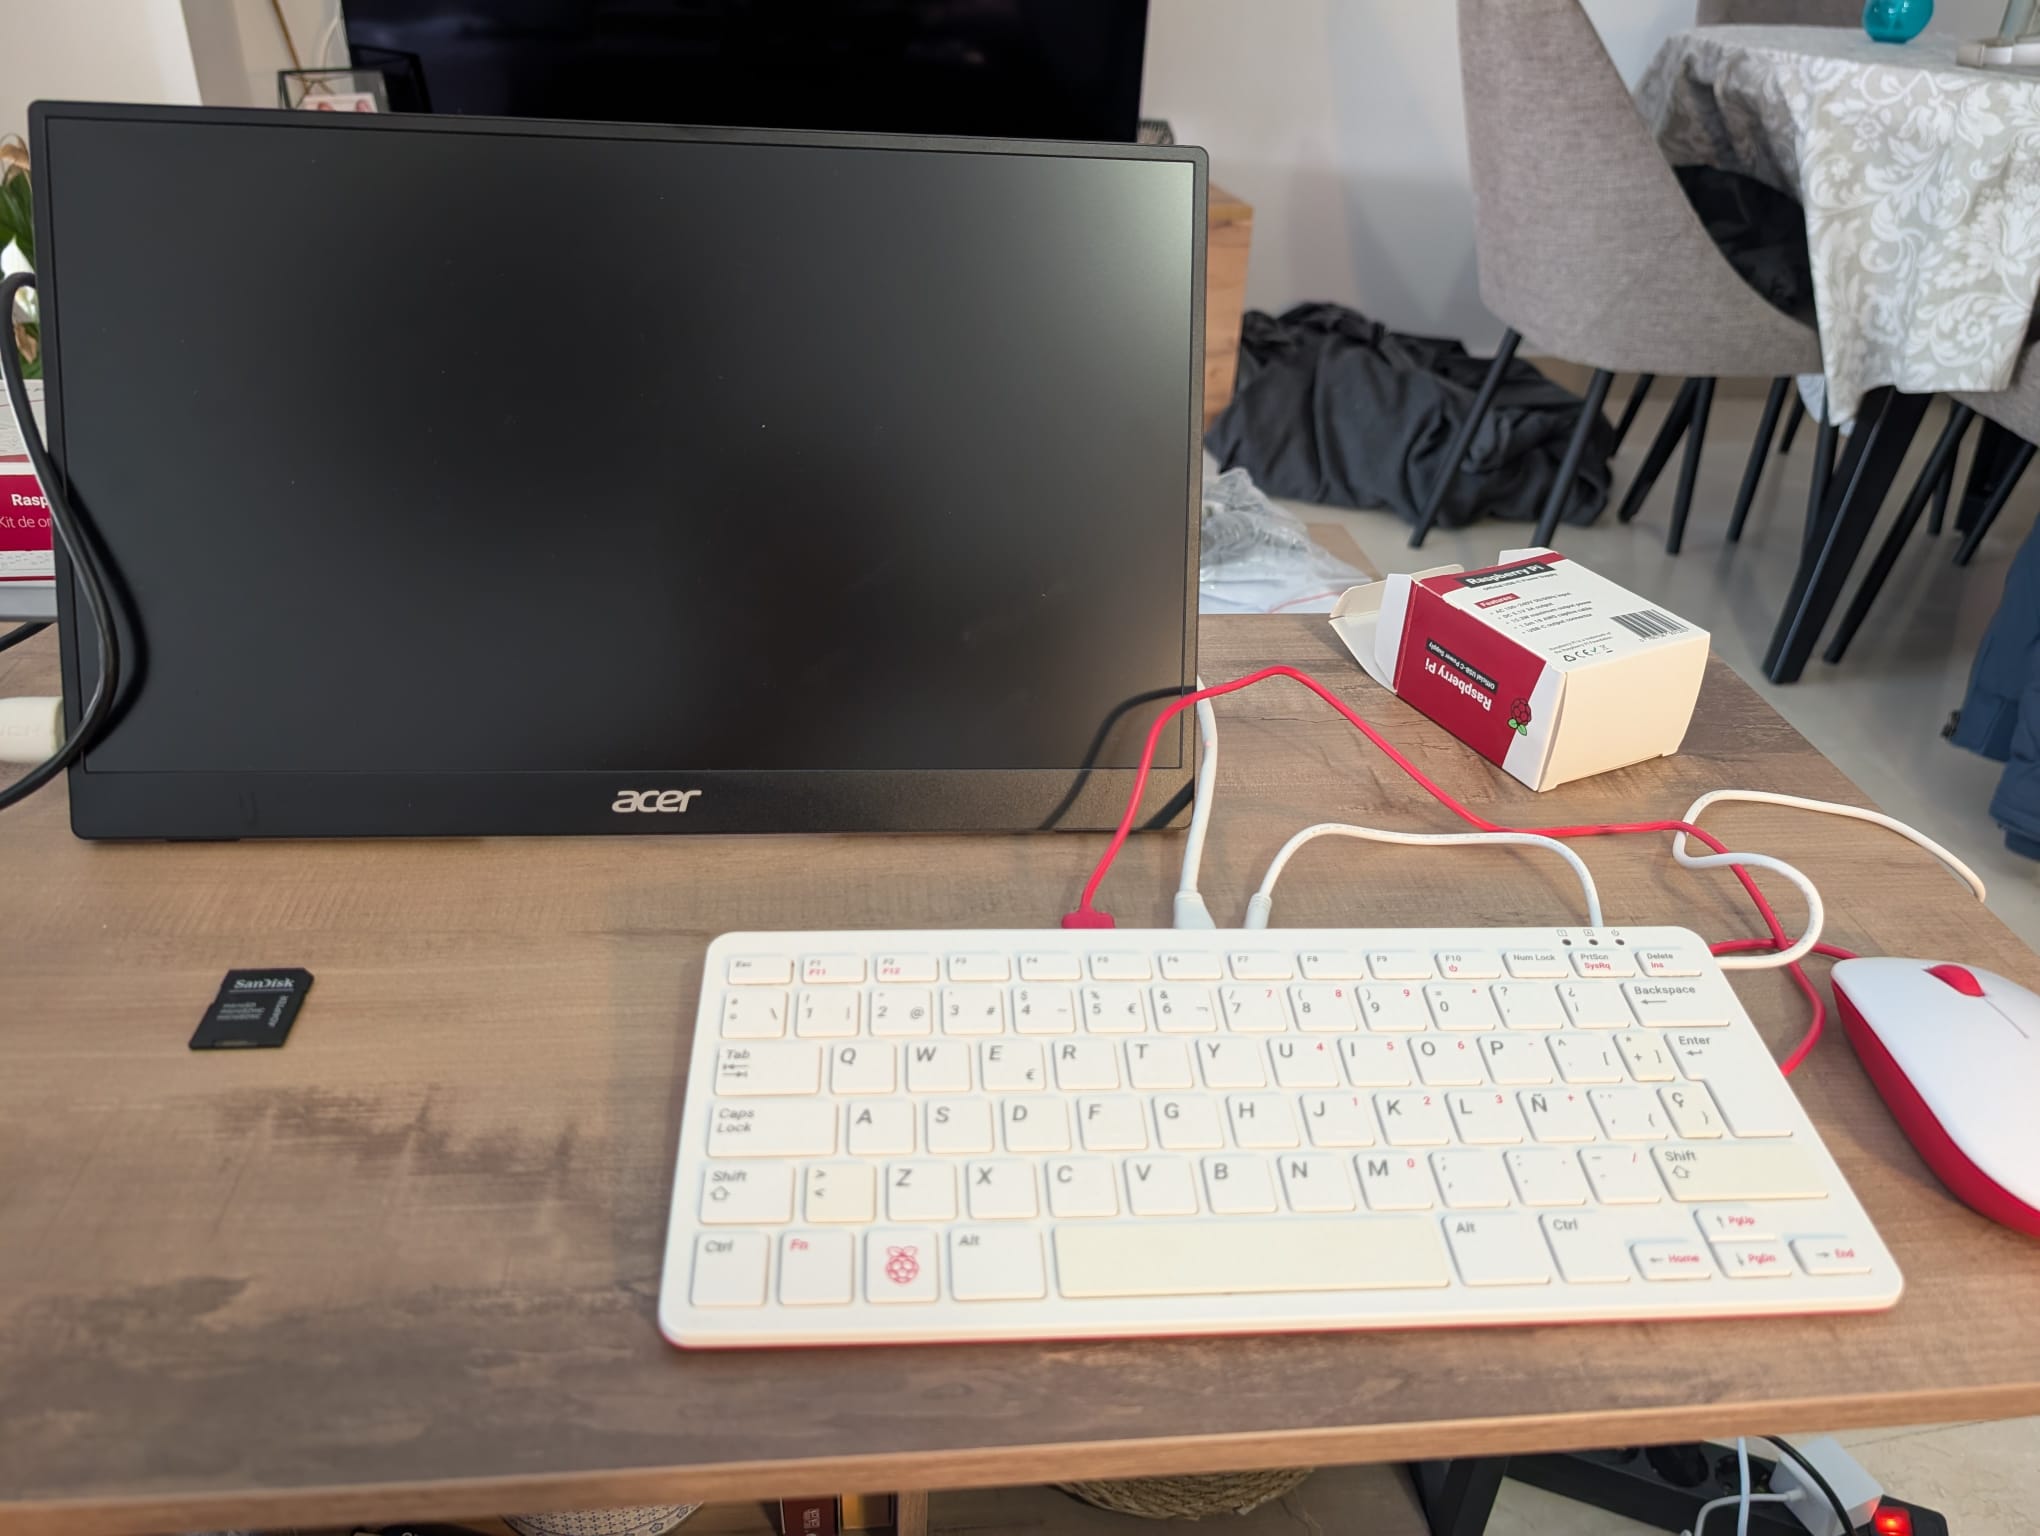
- A Raspberry Pi 4 or Pi 400 (4GB recommended)
- A Sonoff ZBDONGLE-E or compatible Zigbee 3.0 coordinator
- At least one Zigbee sensor (any Zigbee2MQTT-supported device works)
- A microSD card, 32GB minimum (Samsung or SanDisk)
- Basic comfort with Linux and the command line
You do not need a cloud account, a Databricks workspace, or anything beyond the hardware above.
Next: Post 2 — Flashing Raspberry Pi OS Lite and setting up a headless edge node